
All Topics / General Property / Expert Bust #16 – Cheap suburbs fall further
I’ve heard plenty of half-baked experts say that cheaper suburbs are riskier. They say that the more affluent areas closer to the CBD hold their value better. However, historical data during price corrections says the opposite.
Using Distance From CBDFor the 1996 correction:
- Worst 100 falling markets had a median distance to CBD of 35 km
- Best 100 rising markets had a median distance to CBD of 87 km
2008 GFC price correction:
- Worst 100 falling mkts, 17 km to CBD
- Best 100 rising mkts, 47 km to CBD
2011 price correction:
- Worst 100 falling mkts, 24 km to CBD
- Best 100 rising mkts, 33 km to CBD
Using Negative Growth Measures
1996 correction:
- 100 closest mkts averaged minus 3.13% pa growth (experts right for this case)
- 100 furthest mkts averaged minus 4.38% pa growth
2008 GFC:
- Closest 100 mkts –5.86% pa
- Furthest 100 mkts –2.62% pa
2011 correction:
- Closest 100 mkts –5.39% pa
- Furthest 100 mkts –3.7% pa
Most expensive vs cheapest
1996 correction:
- Most expensive 100 city house mkts -2.75% (experts right for this case)
- Least expensive 100 city house mkts -2.30%
- Most expensive 100 city unit mkts -3.23%
- Least expensive 100 city unit mkts -2.44%
2008 correction:
- Most expensive 100 city house mkts -6.88%
- Least expensive 100 city house mkts positive 0.13%
- Most expensive 100 city unit mkts -6.84%
- Least expensive 100 city unit mkts -1.37%
2011 correction:
- Most expensive 100 city house mkts -6.06%
- Least expensive 100 city house mkts -2.09%
- Most expensive 100 city unit mkts -5.85%
- Least expensive 100 city unit mkts -1.87%
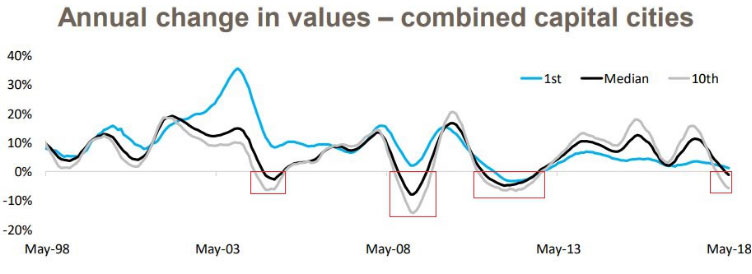
Here’s a telling chart from Core Logic

The cheapest 10% of the market only went negative once. The most expensive 10% dipped 4 times and by bigger margins. And there’s less volatility in the cheaper end (a measure of risk).
Opinions are so much easier to acquire than facts.
You can see more charts in the original report on the Select Residential Property website. Check out Jeremy’s Expert Busting series in the Articles section.
Jeremy Sheppard
https://selectresidentialproperty.com.au/This is a common myth. It is true that tjose affluent areas often get higher growth in an upmarket but they also go lower in a downtown. This means there is more risk so should get a higher return than a more stable asset to offset that risk. As your data shows this isn’t the cae.
HomeBuyerLouisiana | Home Buyer Louisiana
https://homebuyerlouisiana.comAussie entrepreneur investing in New Orleans houses
You must be logged in to reply to this topic. If you don't have an account, you can register here.


