All Topics / General Property / Winston’s Charts
From time to time, I'll post charts of interest to property investors here.
This is an analysis of the after tax internal rate of return for an IP using the 30 years of data 1980 to 2010.

Specific data used is:
Property bought in 1980.
Capital Growth: Brisbane median price as per Residex index.
Std Variable Interest rate from RBA
CPI from ABSYr 1 Gross rent yield is 4.5% and adjusted annually by the weighting (0.33*(cpi+1)+(0.66*capgrowth)
Wage, PAYE Tax, CGT, REA commission, etc are at 2010 levels and adjusted for inflation where appropriate.The chart highlights that IRR does not go up constantly over long periods of time. Rather, swings in capital growth overpower the general rising of gross rent yield.
This should be of concern to anyone considering property investment for retirement, and disposal timing. IRR can fall constantly for as long as 10 years as it did in the 1990s, and it has been falling again since 2008.
_________________________________________________________________
This chart shows the size of the FHB bonus in response to GFC, and what's happened to FHB share of purchases since.
During the 1990s, FHBs averaged around 22% of all purchases. Since 2002, that appears to have fallen 5% to 17%. That's a 22% decrease in FHB share of purchases._____________________________________________________________
Many ask is housing in a bubble. Maybe the better question to ask is household credit growth in a bubble compared to growth in business credit and GDP? From 2000 to 2004, and since GFC, yes it has been. Considering interest on household debt has to be serviced from growth in wages, and wages are tied to GDP, it is highly improbable that household debt growth will continue to outpace GDP.growth
The second graph (credit to nominal gdp) is very important to the savvy property investor. It clearly reveals how credit outpaced GDP from 1993. Many think that credit is misallocated if it does not increase national productivity high enough to pay interest on debt, and the principal in a timely manner. The second chart shows credit growth has not been matched by national productivity growth, which implies borrowed funds have been misallocated. This is an unsustainable trend, and the reversal of the trend since GFC is telling.
__________________________________________________________________________________
Below are Residex monthly cap city medians. The softer market more recently is quite evident.
WW,
Man that must have taken you a lot of your time to compile and thank you for sharing it. Sure it will help many in these forums…
For some of us non economists and simpletons ….how would you sum all that collective information up and what’s your gut feel in the short ( 12 mth) , med ( 3 year) and longer term?
One for the simpletons like me, do you take into account that a pre Sept 87 property would have no cgt liability? What rate(s) have you applied for tax corporate, personal?
thx beedie. I see cap city property growth averaging -5% to 5% pa in nominal terms over the next 5 years.
will all depend on cost of foreign credit, which I expect to tighten eventually.
But that doesn't mean I am a permabear. I'll be keeping an eye out for distressed sellers, particularly on Somersoft forum, and buying something that adds value.
Passive property investing isn't my game.IP Freely, the variables I used are mentioned in the post. but maybe I didn't express it clearly. For paye tax, cgt, etc, I used 2010 figures.
Why? The purpose of the model is not to accurately reflect B&H gains over the last 30 years, but gains of the next 30 years. Long term B&H spruikers like the Somers believe their strategy is as valid today as 30 years ago. they must therefore believe modeling on the last 30 years of economic cycles is more valid than random generated cycles.
Of course, 30 years is a long time, and anytthing could change – negative gearing could be messed with, 50% cgt concessions could be lost. Stamp duty could go right up on investment properties.
I once discussed the advantages of a timing model with a sharp Somersofter many years ago. Both our models indicated buying property at the beginning of a bull run and selling at the end, then swapping into the share market and cash, gave superior after tax returns.
I am happy to see others model this stuff. Some of my gurus are the people at Pimco. and they believe the new normal is B&H is dead. I tend to agree. There's too much volatility and too much debt. Maybe someone will do well over 30 years, but the risk associated with holding all that time will be much higher in my view. and it is all about risk adjusted rewards in my book.
WinstonWolfe wrote:thx beedie. I see cap city property growth averaging -5% to 5% pa in nominal terms over the next 5 years.But that doesn't mean I am a permabear.
That's not being bearish. That's being a realist!
(I agree with +-5%).
Figure there is an abundance of permabull thinking @ the Somers camp from posts here and I hope they do well in their chosen buy hold & hope mind-set, for many it’s a starting point and their circumstances, risk appetite and knowledge dictates if they broaden their approach and time frame their goals which ultimately come back to lifestyle hence 10, 20 let alone 30 years is a long time of hoping and like you it don’t fit in my strategy.
The world seems to be changing in microseconds compared with 30 years ago with instability/debt levels and may I say the doomsdayers turning property markets into a buyer’s market perhaps for years to come,
Matusik said recently “I cannot help feel that we have entered a different paradigm- one in which a dwelling is a home rather than a vehicle for speculation. If that happens, the term “real” estate will regain its true meaning”
We can all read into that what we want
Note the unprecedented higher frequency and amplitude of negative month on month growth in Brisbane's median value.
It might be expected considering the unprecedented growth in the early noughties and that prices have to eventually revert to average debt serviceability and wage growth.This is an interesting chart of housing finance commitments and the standard variable interest rate inverted.
I've inverted the rate to more clearly highlight the negative correlation between rates and prices, that is prices move down when rates move up.
Interestingly, the green shaded area of the early noughties, is the only sustained period of prices moving up in the face of rate hikes.When Australia's premier skin in the game property permabull Chris Joye changes his tack (from ever upwards), you have to believe the market isn't going up in the near future. Some of his recent charts showing the market has flatlined.
I don't know of any free data showing cap city 'time on the market' (and REAs are secretive about such things) so am grateful Chris published this.
My on the ground research says Brisbane's moving average will blow out beyond the GFC 55 day peak in the next 3 months.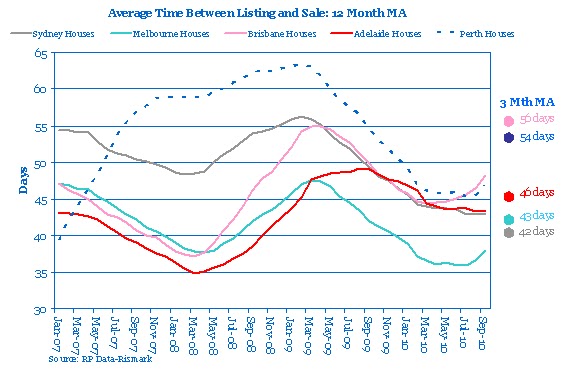
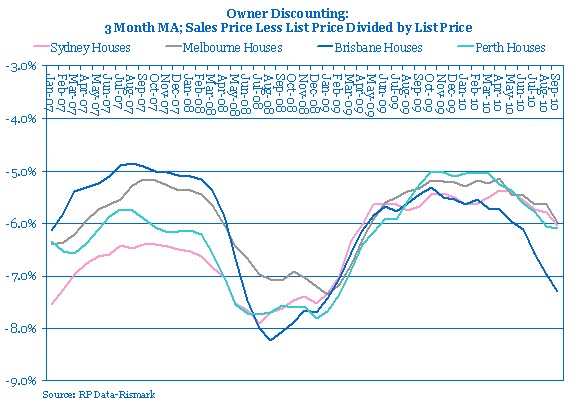
Another valuable chart from Chris' RPData – the discount on list price a property is sold at.
Relistings are now as high as at the peak of GFC, while new listings are fast approaching a 4 year high.
Usually there's a seasonal drop in new listings in January. The extent of the Jan 2011 decrease will be telling.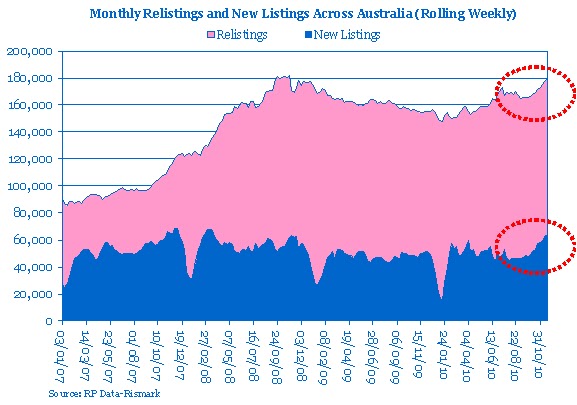
Thanks for posting Winston,
The 'Housing Commitments v IR' is really interesting. Goes to show that it prices could be severely affected without huge rate rises. Next year should be very interesting, especially if rates rise as predicted.
Also, the relistings graph backs up what we've been seeing locally. The Adelaide market has about 40% more houses on the market compared to the same time last year. The Real Estate section in Saturday's paper was so big I almost put my back out lifting it off the table!
Dan42 wrote:The 'Housing Commitments v IR' is really interesting. Goes to show that it prices could be severely affected without huge rate rises. Next year should be very interesting, especially if rates rise as predicted.
Thx Dan. I should have put median prices on the same chart. I think what the 2004-2007 anomaly represents is the further loosening of credit standards such as LVRs, DSRs, post codes, and documentation. I'd posit this overwhelmed the tightening effect of rate rises. I'd say lenders were able to continue sourcing large amounts of foreign credit, and were resisting the RBA's attempts suppress credit supply via higher rates.Also, the relistings graph backs up what we've been seeing locally. The Adelaide market has about 40% more houses on the market compared to the same time last year. The Real Estate section in Saturday's paper was so big I almost put my back out lifting it off the table!
Appreciate the Adelaide on the ground picture. Listings are up 50-100% in Brisbane outer and mid ring burbs, though vendors are yet to drop prices significantly. I expect downwards pressure to build in autumn next year. And that's when I might be making low ball offers on development sites. Nevertheless, I'll be following the rates outlook.
The chart below is the ASX's 18 month forecast on the Aussie cash rate. Only another 2 x 25bp rate rises built in at this point, but then bank cost of funding could still increase beyond that, as it has been.
WinstonWolfe wrote:Listings are up 50-100% in Brisbane outer and mid ring burbs, though vendors are yet to drop prices significantly. I expect downwards pressure to build in autumn next year. And that's when I might be making low ball offers on development sites. Nevertheless, I'll be following the rates outlook. agree…Banks need to lend money to make money… so maybe we will also see some easing mid next year … perfect receipe
WinstonWolfe wrote:My on the ground research says Brisbane's moving average will blow out beyond the GFC 55 day peak in the next 3 months.WW I have a strong suspicion that we already there my friend …… from my own and my different contacts personal experience with properties on the market at present
For any one interested have a look on this site. It’s a guide to days on the market http://www.refindhouseprices.com/
beedie wrote:WW I have a strong suspicion that we already there my friend …… from my own and my different contacts personal experience with properties on the market at present
For any one interested have a look on this site. It’s a guide to days on the market http://www.refindhouseprices.com/
Thanks Beedie. I suspect you are right that it is already >55 days.
I have RPData which is essential when making offers imho. Gives advertising history week by week, for sales and rent.
Though refindhouseprices is a bit easier to skim a lot of houses in a burb.Here's a silly story.
Consider we have oafey slow thinking do gooder ideologues in the RBA and Fed Govt who finally realize affordability might be an issue.
So the RBA decides it will now consider asset price inflation in setting the cash rate.
Hmmmm……ok, so house prices too high -> raise rates, even if conventional inflation is within the target band.
Hmmmm again…..that decreases the amount buyers can borrow, and increases the cost of building new stock.Population growing at 1.5-2%pa.
Housing supply drops below 30,000 per qtr.Hmmmm indeed.
WinstonWolfe wrote:Here's a silly story.
Consider we have oafey slow thinking do gooder ideologues in the RBA and Fed Govt who finally realize affordability might be an issue.
So the RBA decides it will now consider asset price inflation in setting the cash rate.
Hmmmm……ok, so house prices too high -> raise rates, even if conventional inflation is within the target band.
Hmmmm again…..that decreases the amount buyers can borrow, and increases the cost of building new stock.Population growing at 1.5-2%pa.
Housing supply drops below 30,000 per qtr.Hmmmm indeed.
Lol….. Silly story consider we talking reality my friend……
But don’t fret Mr Joe Blow here in Qld we are leading the way with the Bligh government instigating the “ Building Revival Forum” bureaucratic talkfest that’s bound to add more dead weight more regulations and believe it or not more bureaucracy ……
Hmmmm indeed the fairy tale
continues …..Beedie, of course, the best fiction is based on true life
I can see the govt will eventually yet again have to intervene to stop house prices dropping dramatically in a short period…..presumably when foreign credit contracts, even moderately. ….that means another govt backed guarantee for Aussie bank foreign borrowing.
Socialize the losses, and privatize the gainsHmmmmmm…..
Moving on, I've been messing with some charts. I've always felt number of finance commitments was possibly a slight leading indicator of house prices.
Below is rolling Annual % change in total Australian finance commitments versus rolling Annual % change in Sydney house residex index
I have to go away and contemplate the smoothing and lag effect introduced by rolling annual numbers…..but at first looks, correlation seems reasonable.Eventually, I'd like to account for most house price movement. My guess is interest rates and unemployment. have historically accounted for most of the influence.
Though looser lending standards since banking deregulation will have muddied the waters.All charts from RPData
Qld and WA lead the fall in building approvals. Has to be due to the banks not wanting to lend in Bris and Perth moreso.
If prices stay flat or fall, at least rental yields improve quicker.
FHB activity is stronger in some states than others. In order of strength : Vic, WA, NSW, Qld, Tas, SA, NT, ACT
Population Growth
Slowing
because of net migration
NSWers have had been flooding into QLd for years, but have slowed since March 2009. This presumably accounts for much of the drop in Qld house prices.
Nevertheless, pop growth in eastern states is still historically strong.
Charts from Aussie Macro Moments
Total listings is quite revelatory regarding the weakness in the Qld market. Considering the smaller population, Qld now has more listings than Vic and NSW.
I'd say this has something to do with the discretionary nature of the Sunshine, Gold and Fraser Coast markets, and the more recent weakness in Brisbane.
There's no doubt the softening has been national since September 2010.Note the chart heading should read Jan07 to November 2010
Housing Finance Commitments
The trends for Qld and WA are a lot weaker than NSW and Vic.
Qld commitments have dropped to 2001 levels and WA to 2000 levels.The decrease in commitments since preGFC are:
NSW 27.5%, Vic 13%, Qld 33%, WA 31%Winston….. Interesting last few graphs
Property bubble???? Seems like a pending up demand bubble ……. lol
WinstonWolfe wrote:Here's a silly story.
Consider we have oafey slow thinking do gooder ideologues in the RBA and Fed Govt who finally realize affordability might be an issue.
So the RBA decides it will now consider asset price inflation in setting the cash rate.
Hmmmm……ok, so house prices too high -> raise rates, even if conventional inflation is within the target band.
Hmmmm again…..that decreases the amount buyers can borrow, and increases the cost of building new stock.Population growing at 1.5-2%pa.
Housing supply drops below 30,000 per qtr.Hmmmm indeed.
Your silly story makes more and more sense……… keep reading the story Mr Storyteller ……


")


You must be logged in to reply to this topic. If you don't have an account, you can register here.