
All Topics / General Property / Expert Bust #11 – Apples & Oranges
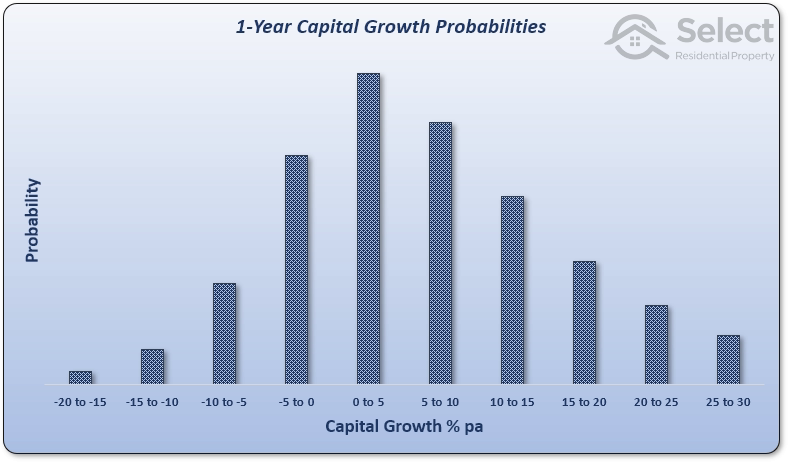
Data suggests that the longer the time-frame, the more likely 2 suburbs will end up with the same long-term growth rate even if they are in different cities. The following chart shows that the majority of 1-year capital growth has been between 0% and 5%.

This chart was derived from an examination of over 40 years of growth history for suburbs across Australia. There were a lot of 1-year periods in the last 4 decades. There were thousands of cases of double-digit growth over a single year.
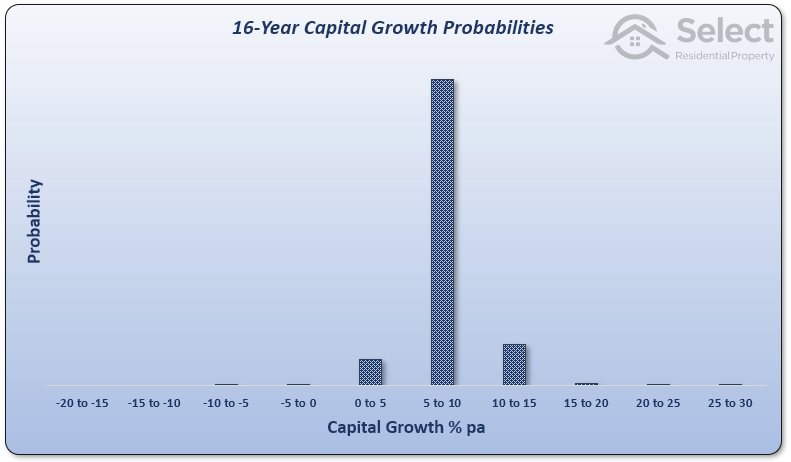
Here’s the 16-year spread…
It’s pretty boring over 32 years, just a single bar.
There’s a tendency for all suburbs to grow at roughly the same rate over the long-term. The reason for this is called the Ripple Effect. When prices get too high, buyers look for the next best alternative.
Imagine apples were 1c each a hundred years ago and oranges were 2c each. Now imagine apples grew at 4% per annum while oranges grew at 8%. Today a single apple would cost 50c while a single orange would cost $44.
The higher price for oranges subdues demand for them. Apples are considered the cheaper alternative and that increases demand for them. Growth of apples accelerates while growth of oranges decelerates until balance is restored.
Trying to find a high growth outperformer is going against basic human behaviour.
Jeremy Sheppard
https://selectresidentialproperty.com.au/
You must be logged in to reply to this topic. If you don't have an account, you can register here.


