All Topics / General Property / Brisbane house price growth 1979-2011
What it tells me is we have entered the 3rd year of decline and; that given the negative ToT figures, signals from resource companies of declining prices and a slump in coal prices as China slows down, that in all likely hood QLD will to see continuing downward pressure on median house prices for the foreseeable future.
….increased activity taking property out at lower levels rather than sellers withdrawing listings being the gis
In other words falling prices as sellers accept lower offers.
The Freckle
I am selling in the Ashgrove market and have been pleasantly surprised by the rate of sales and the number of lookers turning up at openings. Seems like family homes are moving again although the demand may be artificially strong due to the lack of stock. Could be that once the would be sellers see some decent sales they will also list, pushing up supply and then we are back to 2011. Hope not, and I hope that there aren’t that many new listings coming on in the short term that I will have to compete against.
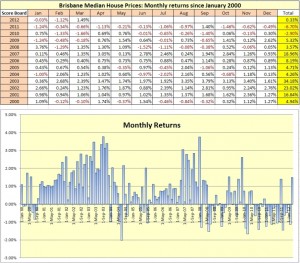
Brisbane recorded the strongest monthly growth since December 2009 this month. The +1.49% result in March has Brisbane in the black for the year with 0.33% growth in the index.
The turnover has been healthy since December 2011 and not surprised to see this monthly result and the market near balance in prices, the last few weeks have been a little slower but still much better than last year.
Andrew_A wrote:Brisbane recorded the strongest monthly growth since December 2009 this month. The +1.49% result in March has Brisbane in the black for the year with 0.33% growth in the index.The turnover has been healthy since December 2011 and not surprised to see this monthly result and the market near balance in prices, the last few weeks have been a little slower but still much better than last year.
Well this should bode well for my upcoming sale.
Unfortunately it looks like Residex have decided to start charging for the city wide monthly data series which makes a lot of these graphs difficult to continue.
http://www.rpdata.com/research/monthly_indices.html
Would appear to be the best alternative for the moment.
Interesting thread, keep it up.
You must be logged in to reply to this topic. If you don't have an account, you can register here.


